E-commerce Trends 2023: Top 11 Statistics
Published on June 05, 2019

There is a tremendous amount of decisions to be made when managing an e-commerce.
The best decisions that spur the development of an online store are based on facts and hard data.
|
To better position yourself, you need to understand:
|
This article will discuss these topics, along with 11 statistics you should know about retail e-commerce to help you increase your market share.
[Statistics below are in US dollars for the purpose of comparison.]
Statistics You Should Know About Retail E-Commerce
1. Projections on retail e-commerce in Canada
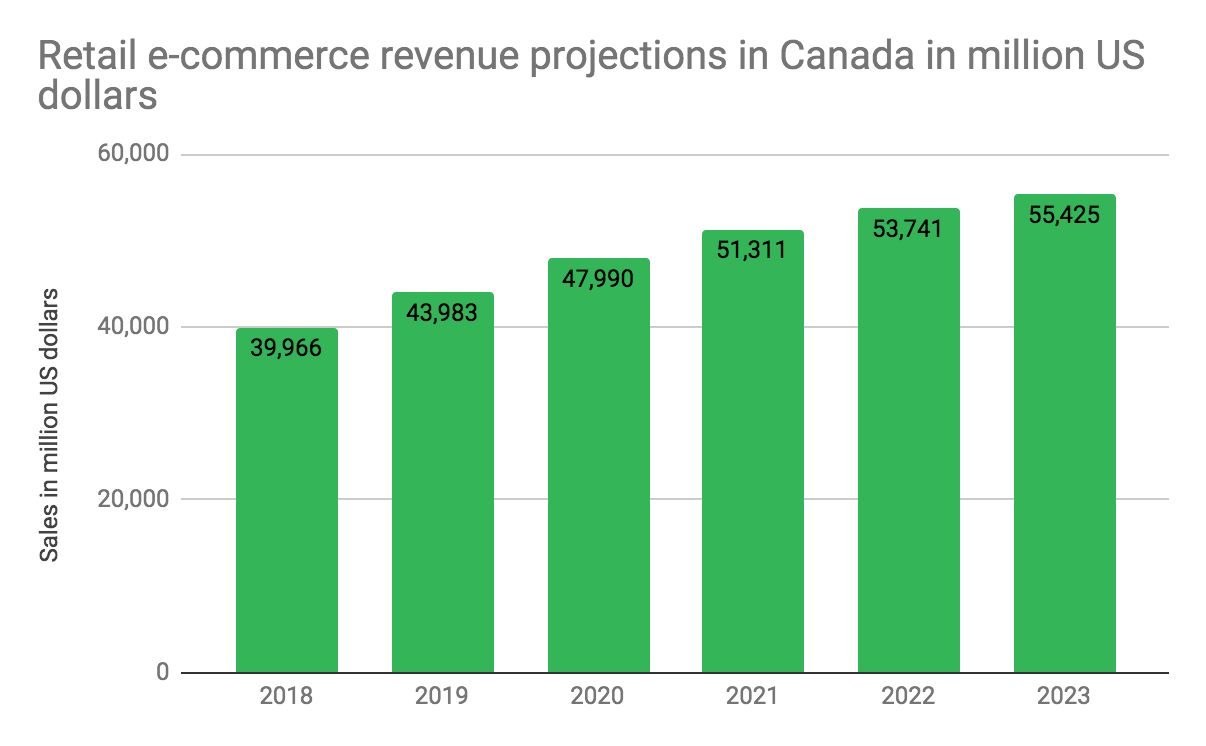
Retail e-commerce in Canada is booming: a nearly 40% growth is expected in the next 5 years. By 2021, a 28% increase is forecasted.
In 2018, retail e-commerce sales of physical goods amounted to almost 40 billion US dollars and are projected to increase to 53.7 billion US dollars in 2022.
 Source: https://www.statista.com/
|
The takeaway: The Canadian market is booming. You could therefore choose to focus your efforts on this market and experience a similar growth. |
2. Projections on retail e-commerce worldwide
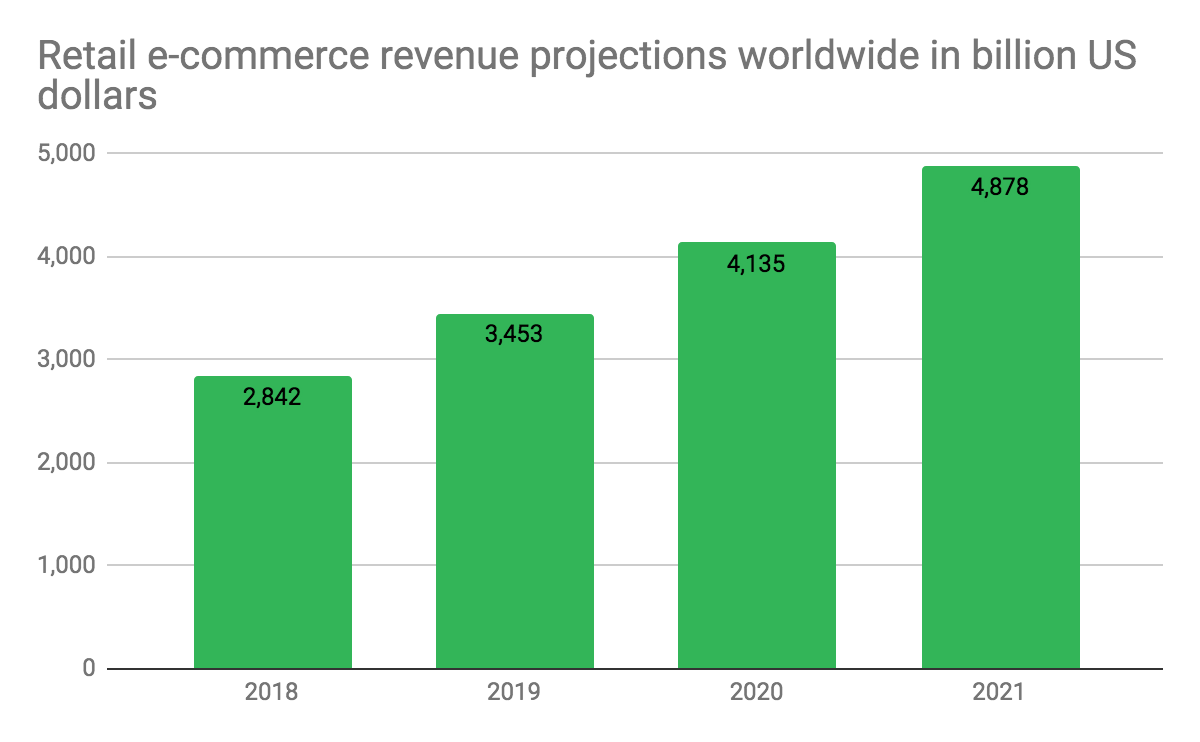
What about internationally? The growth should be even more dramatic. From 2.8 trillion US dollars in 2018, revenues are projected to grow by more than 70% in the next 4 years to more than 4.9 trillion US dollars in 2021.
 Source: https://www.statista.com/
Based on these projections, online purchases are increasingly popular. The difference between the growth projection for the Canadian market (28%) and the global market (70%) show that the challenge might be outside of Canada for the next three years.
|
The takeaway: If you want to increase your turnover, the global market is very promising. |
3. Online sales by country
Online sales are evolving daily and globally. Yesterday’s major players are being replaced by new emerging markets.
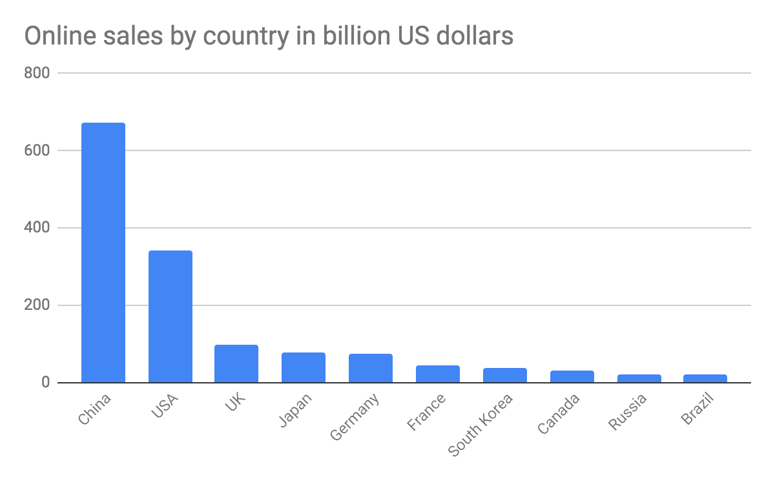
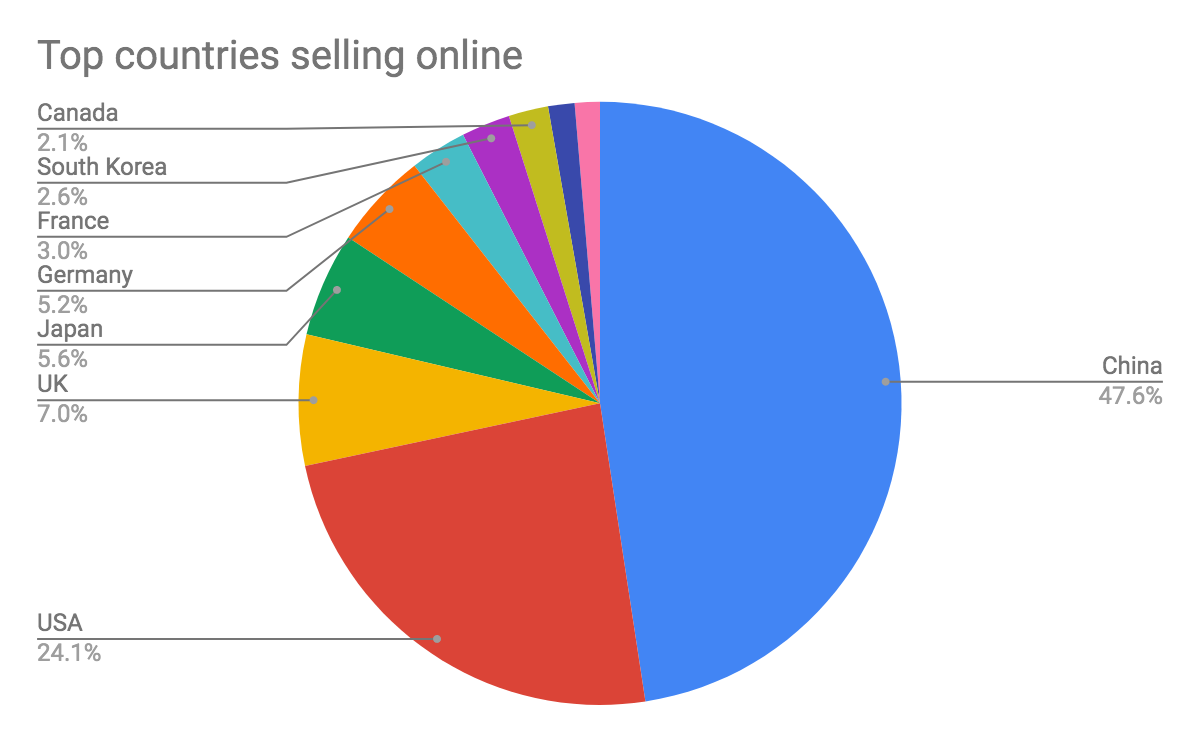
After having dominated the online sales market for a decade, the US has recently been surpassed by China, now the uncontested leader with 672 billion US dollars in sales yearly, in big part due to the Alibaba group.
The US is now a distant second with online sales of 340 billion US dollars yearly due in big part to giants such as Amazon and eBay.
The other countries rounding out the top 10 are shown in the following two diagrams:
 Source: https://www.business.com
Source: https://www.business.com
As you can see, Canada is ranked 8th with online sales of 30 billion US dollars, in large part due to Amazon and Costco.
|
The takeaway: According to experts, the Canadian market holds a huge potential without great competition. That is good news for Canadian businesses! We are here and we know our consumers since we share the same culture… We therefore have a step ahead of foreign brands who are beginning to turn their focus towards our market wanting a piece of the pie. All you need is to develop an interesting offering and be competitive! |
4. Growth of online sales by country
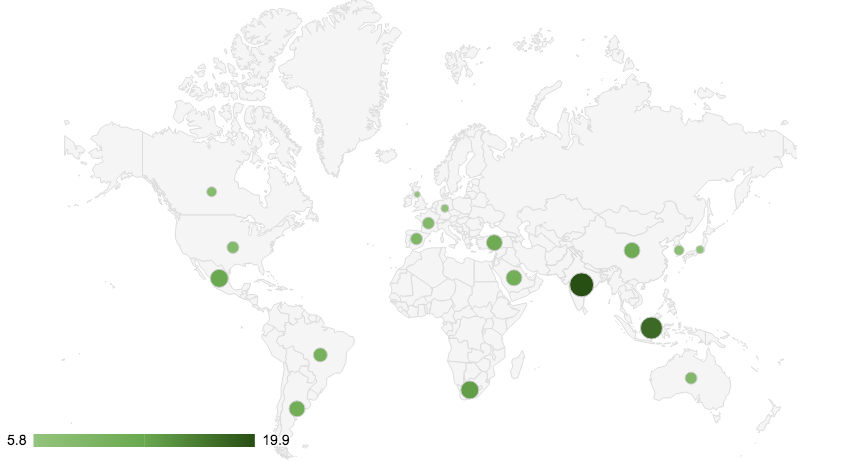
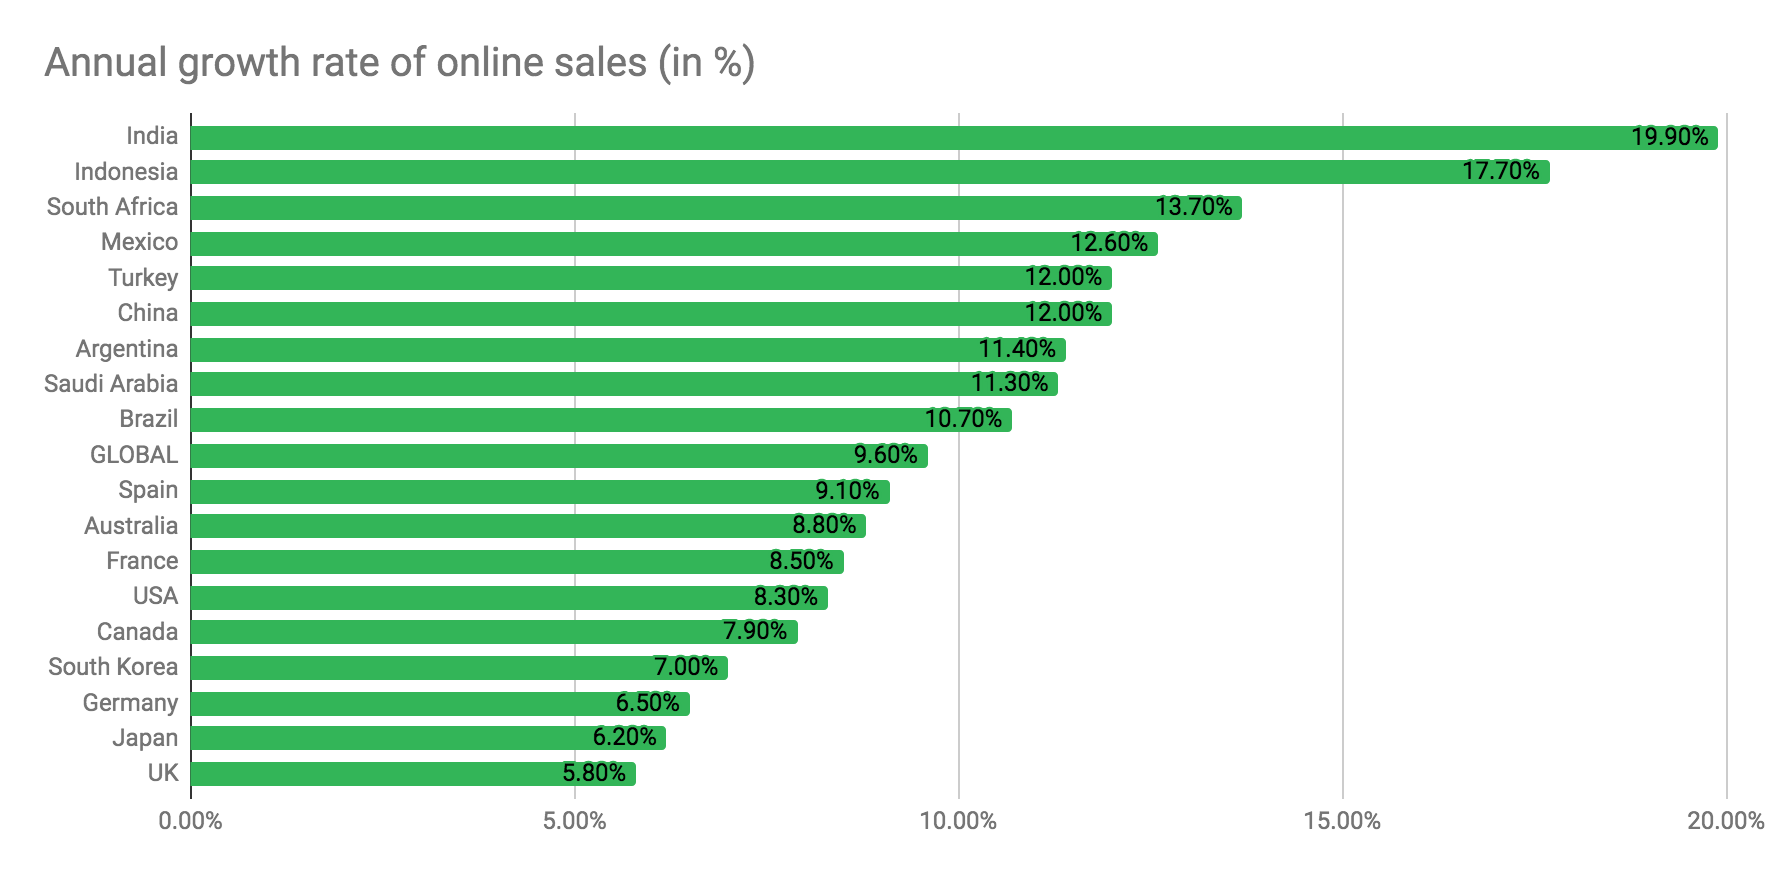
Will the ranking above prevail? What are the emerging markets in terms of online sales?
Annual growth rate of online sales (in %)
Source: https://www.statista.com
 Source: https://www.statista.com
The overall global growth should be around 9.6%. India and Indonesia are the countries with the most robust growth, while Canada trails somewhat at 7.9%, even though the Canadian market holds huge potential, potential which doesn’t seem fully realised.
|
The takeaway: Emerging markets will eventually want to claim their portion of the Canadian market, if not already done. Not having to deal with the same regulations and resources, these competitors could prove very fierce. |
5. Domestic and overseas purchases
Online sales are in full growth in the countries mentioned above, so where do the consumers come from?
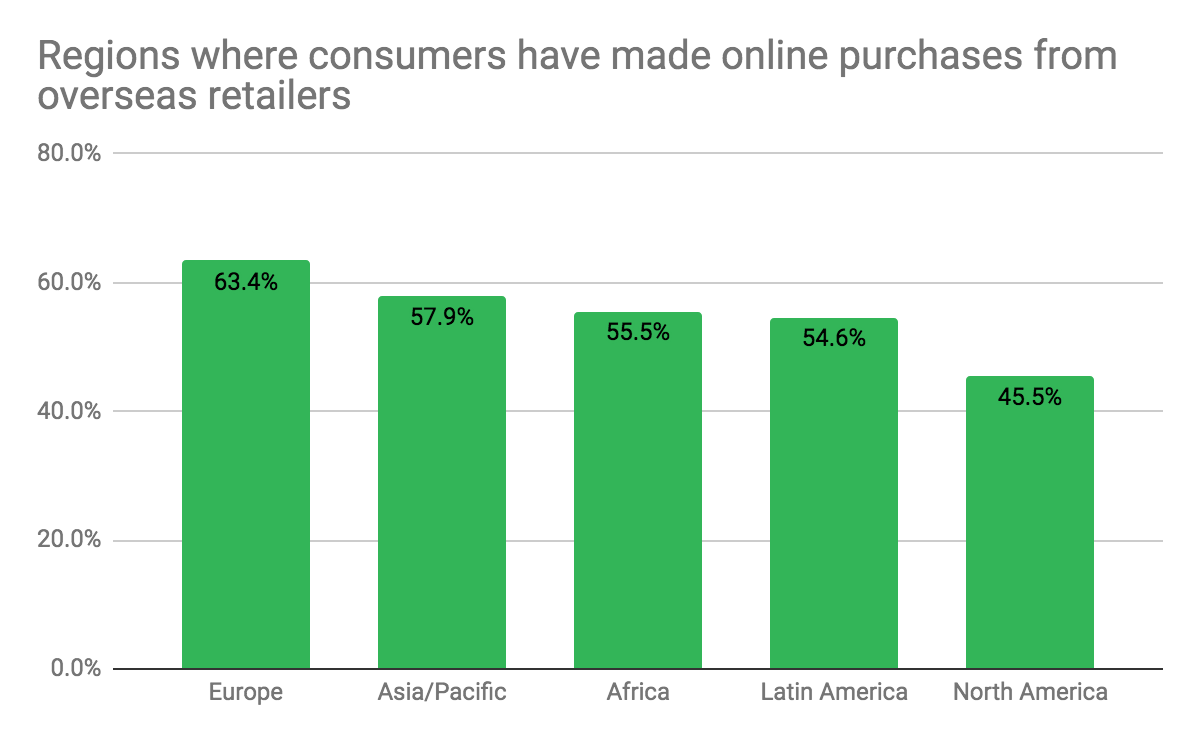
The fact is, 57% of online shoppers worldwide made purchases from overseas retailers in the last six months.
Here are the regions where consumers have made online purchases from overseas retailers:
Source: https://www.shopify.com
From these statistics, we clearly see that e-commerce has no borders, so the potential for selling your retail products and services overseas is tremendous.
|
The takeaway: If your online store is in French only, the worldwide francophone market could be an interesting opportunity, whether it be in Europe, in Africa or elsewhere, since consumers are already accustomed to making purchases from overseas retailers. |
6. Consumer specifics
What are the challenges for online stores wanting to sell overseas?
First off, the website language.
Truth be told, 75% of shoppers worldwide prefer not to make a purchase unless the site is presented in their native language.
Second is the currency.
According to statistics, 92% of consumers worldwide prefer shopping and buying from a business who displays prices in the local currency.
Similarly, 13% of people will leave their shopping cart if the prices are presented in a foreign currency.
Lastly – and this applies to both domestic and overseas purchases – 28% of shoppers will abandon their cart if there are unexpected costs. People don’t like that kind of surprise, so it is best be as transparent as possible.
|
The takeaway: If you want to penetrate francophone markets outside of Canada, present your prices in the local currency and display shipping costs and any additional fees as soon as possible in the checkout process so that you don’t lose sales due to unexpected surprise costs. |
7. Payment preferences
In North America, more than 75% of shoppers prefer to pay for their purchases by credit card. Other methods of payment preferred by North American consumers are PayPal and Apple Pay, at nearly 38%.
Why should you put in place these payment types? Well, up to 16% of shoppers will not make a purchase if their preferred payment type is not offered.
|
The takeaway: It is important to put in place the payment types your target shoppers prefer. |
8. Devices used for online purchases
Worldwide in 2018, the computer was still the most-used device to make online purchases. However, mobile devices, smartphones in particular, are becoming more and more popular.
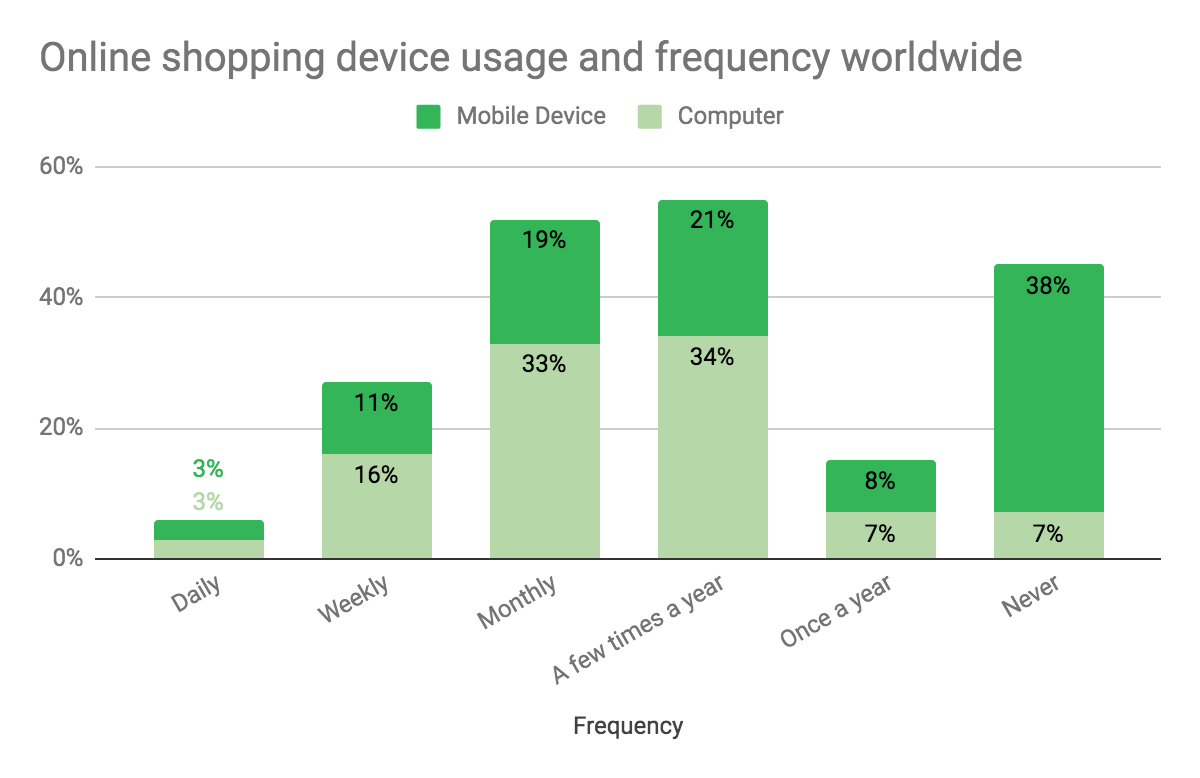 Source: https://www.statista.com
|
The takeaway: Since purchases made through mobile devices are increasingly popular, make sure your online store is practical and easy to navigate on tablets and smartphones. |
9. Features that make for a great shopping experience
What elements are required to make an online shopping experience great to shoppers? The following statistics paint the portrait:
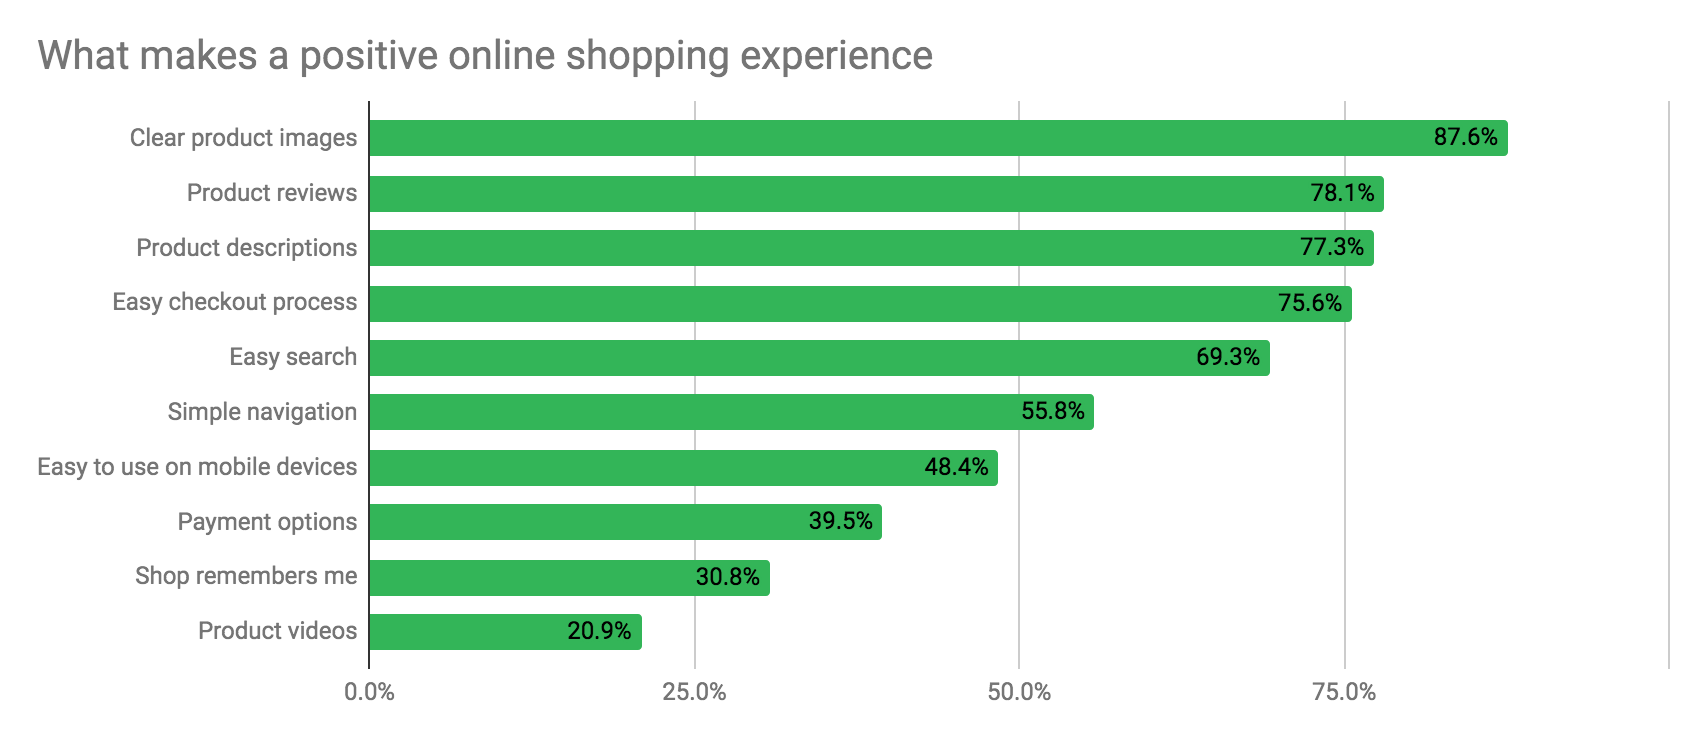 Source: https://www.statista.com
Quality product images and descriptions are crucial to the success of an e-commerce.
Also topping the list are authentic product reviews that will allow shoppers to get a clear picture of what to expect of the whole buying process.
|
The takeaway: With these elements in mind, make sure to meet the needs of consumers. |
10. Shipping of the goods
What about the delivery of the merchandise purchased online? What do consumers expect in this regard?
In the US, 44% of online shoppers choose the slowest transit time only because it’s free.
Yet, 63% of consumers expect their items to be delivered within 3 days of purchase.
Even if they choose free shipping, 80% of shoppers expect a delivery within 7 days of purchase at the latest.
What are the most popular delivery services? With the above statistics in mind, it is no surprise that express deliveries are most frequently chosen.
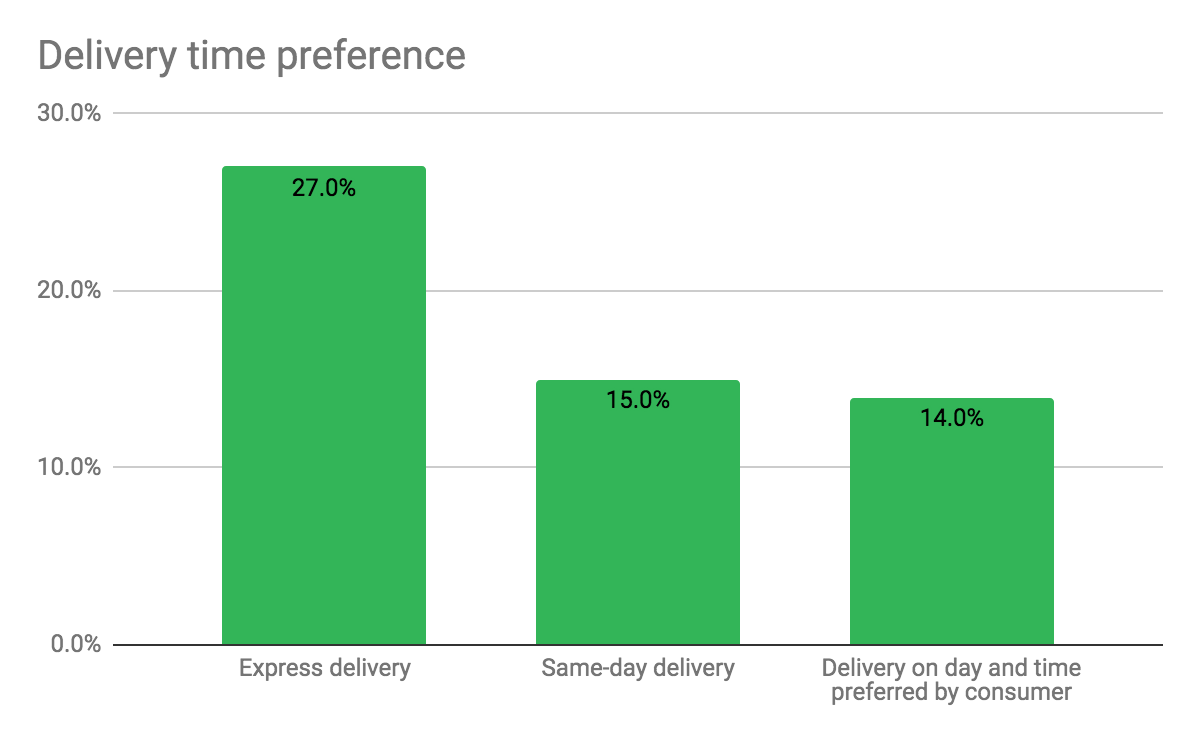 Source: https://www.statista.com
However, are these shipments always delivered on time? For parcels delivered through Canada Post, whether it be Priority, Xpresspost, or Expedited Parcel services, up to 20% of packages are delivered late.
Note that shipping fees can be reimbursed if a package is delivered late, even if by only one day! Click here for an estimate of how much you could get reimbursed for your packages delivered late.
|
The takeaway: The ideal scenario would be to offer your customers free shipping on packages that can be delivered within 7 days and accelerated shipping for those who want their order within 2 days. |
11. Social media platforms most used to buy online
Many social media platforms now offer their users to make their purchases directly through their platforms. In 2018, 18% of Americans had stated having purchased products directly via social media.
Which platform is the most popular among consumers? Here are the different platforms on which US consumers have made a purchase directly from a post:
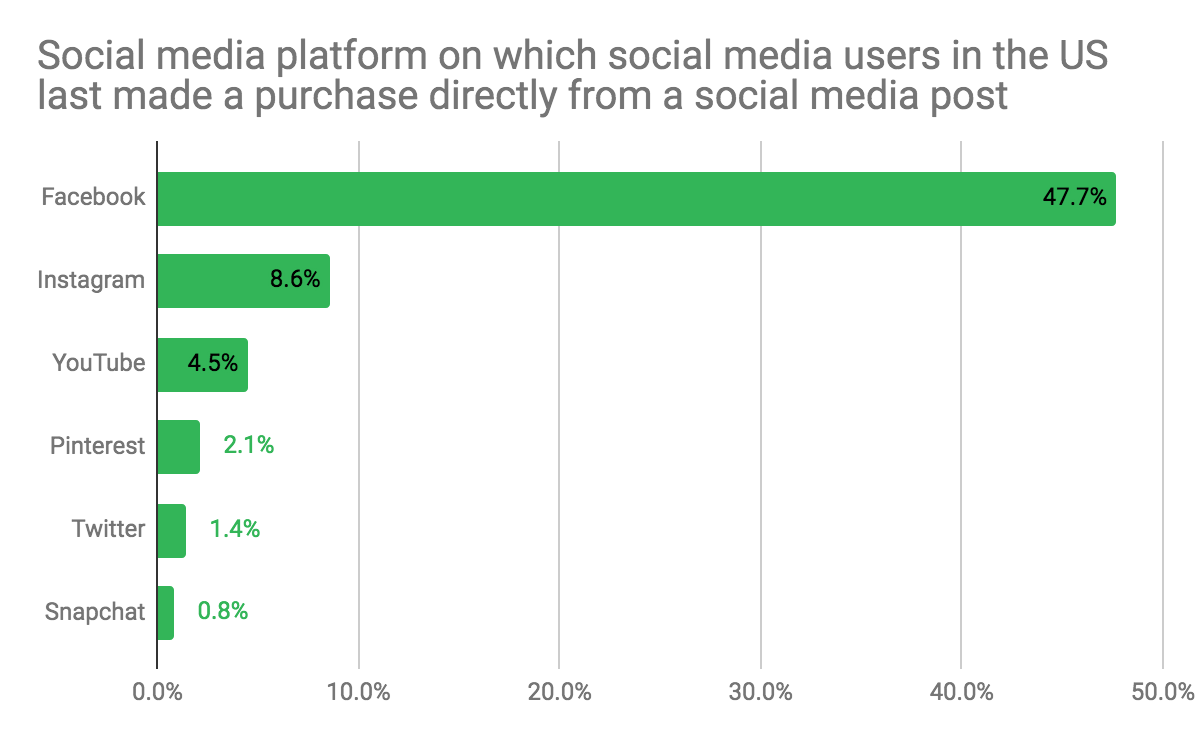 Source: https://www.statista.com
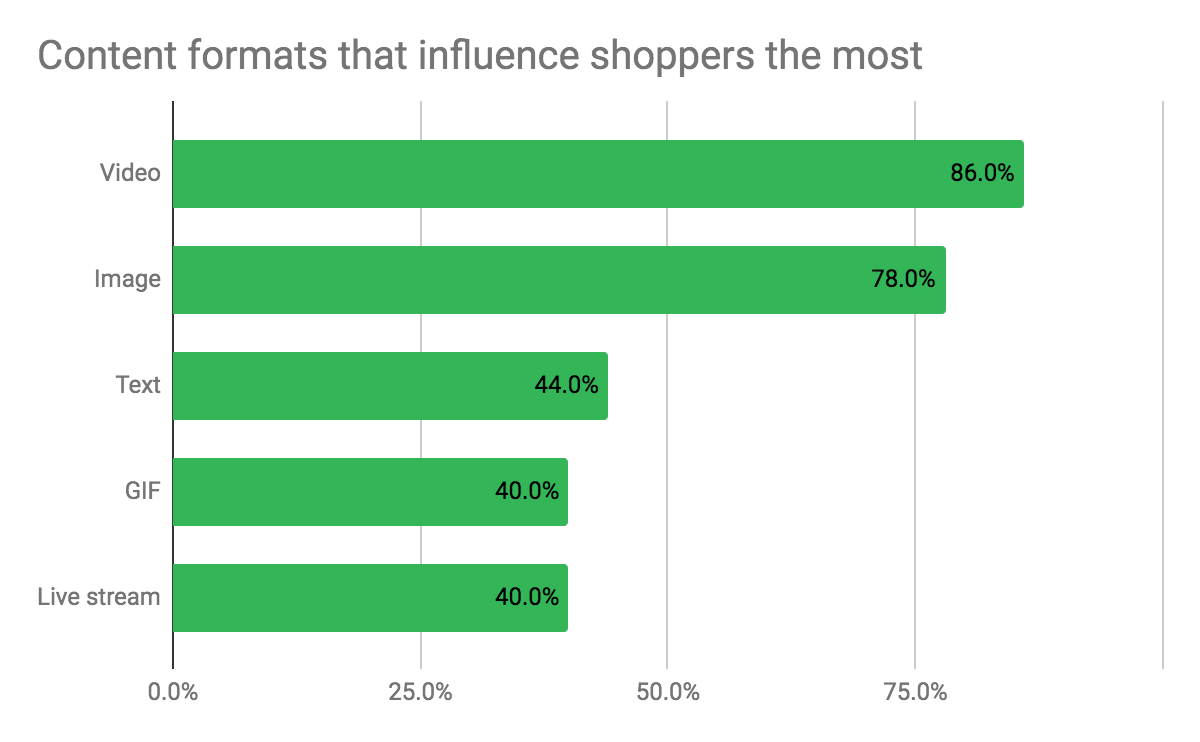
Now, which type of content has the most influence on users? You probably guessed it: videos have the strongest influence on consumers at 86%, with images following closely at 78%.
 Source: https://www.statista.com
You may have apprehensions just thinking about making videos, especially if you are managing your business alone… Interestingly though, even if videos have the most influence on consumers, images are almost just as influential.
Therefore, if you don’t have the time to shoot an interesting sequence to promote one of your products, know that quality images will just about do the same.
|
The takeaway: If you haven’t already done so, start by dedicating resources to promote your brand and sell your goods and services on social media – Facebook and Instagram first – and if possible, with a few videos. |
With all of these stats, online retailers can really benefit by understanding the global position of e-commerce worldwide.
Which of the above data most surprised you? What adjustments will your e-commerce business need to make to better meet the expectations of the market as described above?
We look forward to hearing back from you with your experiences and feedback


